This page contains a prototype of the Self-Similarity Telescope, a tool for detecting self-similarity and divisibility relations between a sequence and its subsequences. This is part of Numberscope. This is a prototype, please expect bugs!
To launch the prototype, open the following link in Chrome (or another browser supporting the new implementation of bigint in Javascript): Self-Similarity Telescope.
Give it a minute to load!
Some tips and tricks:
- To understand the screen in default setup, imagine the sequence laid out horizontally across the first row: w1, w2, w3 … ; the next row is simply translated, beginning w2, w3, w4, … ; the next row is w3, w4, w5, etc. A pixel is bright if the translated term is very close to the corresponding untranslated term above it in the first row. Colour indicates the sign of the difference.
- You can also increase the contraction, comparing the sequence w_2n with w_n for example.
- There are three modes to cycle through, by pressing ‘x’:
- Distance similarity: the small circle at position shows how close the terms are
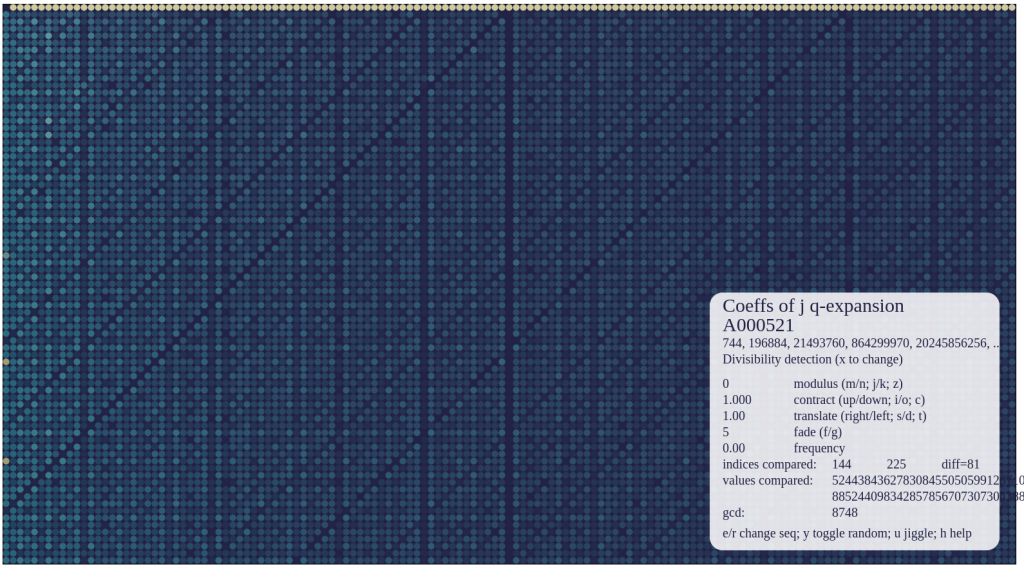
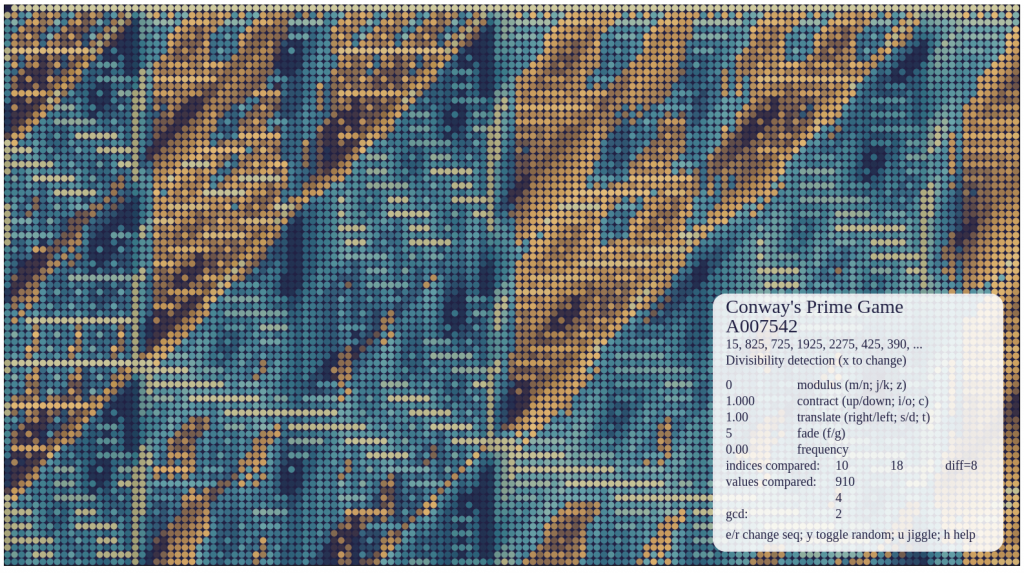
- Divisibility detection: the small circle is bright when the two terms have a large gcd
- n-adic similarity: like distance similarity for the n-adic valuations of the sequences
- To get started seeing some pretty pictures, I suggest tapping 9 and 0 to cycle forward and backward through some interesting presets. You can also tap e and r to cycle forward and backward through the full set of several dozen hard-coded sequences.
- Things you can do:
- Set a modulus to consider the sequence modulo.
- Jiggle the sequence by a small amount, to see if your pattern survives (is associated, for example to growth rate) or disappears (is dependent upon the exact values of the terms).
- When using a modulus, toggle back and forth between a random sequence modulo that modulus, to see if you pattern is “real.” For example, terms are repeated on the screen in the default setup, so some diagonal lines will appear even in random sequences.
- Change the fade depth (f/g) to reveal more features.
- Mouse over a position to understand the values compared.
- Press ‘h’ for more options
What to look for in Distance Similarity Mode:
- Especially for entirely positive, growing sequences, this will tend to show the growth rate of your sequence. This can sometimes be enhanced by playing with the modulus feature.
- Striking features such as lines will sometimes indicate self-similarity in the sequence.
What to look for in Divisibility Detection Mode:
- When the app first opens, it is set to the integers. Press ‘x’ to see the divisibility detection picture for the integers. When elements of this picture are repeated for other sequences, this indicates divisibility properties. For example, the Fibonacci numbers look very similar to the integers, because F_n | F_m whenever n | m.
- In the initial setting of t=1 (translate by one each row) and c=1 (no contraction), there is a diagonal line heading down from the upper left at slope -1 which corresponds to comparing w_n with w_2n. If this line is highlighted, it indicates that these term pairs tend to share factors.
- When the picture associated to the integers, including the line referenced above, is a bit wavy, this is usually because your sequence is approximating a sequence with divisibility properties, such as the integers.
Some screenshots